Data Extraction (CSV File) using Python

Introduction:

Python is used to extract data from Web using built-in functions available in many libraries. There are two methods of extraction of data using python. First one is accessing directly a CSV file which is available on internet and the second one is web crawling or scraping.

In this post, I am going to discuss this using accessing CSV file.

Pre Requisites:

Python framework should be installed (I am using Jupyter Notebook)


Python Libraries:

  1. CSV
  2. Requests
  3. Pandas

Python Code:

import csv
import requests
import pandas as pd

pd.set_option(‘display.max_rows’, 500)
#Extracting CSV dataset of FIFA world Cup

CSV_URL = r’https://storage.googleapis.com/kagglesdsdata/datasets/19728/29747/WorldCupMatches.csv?GoogleAccessId=web-data@kaggle-161607.iam.gserviceaccount.com&Expires=1590381540&Signature=bF3C%2BwKUiHytcGwncgskHxhsXx8XBqlpBGxJfM5694W4iho7QbnoTGwv4TwVkBcFBlfYszsFv2RWmziPnQomx3MqLU7UHbgQHYre0lznrZ8yhBXybwUSMy1ybAxzCM1iTBCSeSpHUafudW%2FpMJg%2FXMjU2KLWkxoTQrzAPxLDPq3%2FM6eyoI1XsdADcNG9VzWzvro3tPz8YgxxUIn2TZJMu7TCZ2jT9coH%2FdanTsS5aBe3jJ1t4ja577IMGBALTI8RmM65mkS5TTXiKMzc57N4QmfZqQfQdKzkasT81UHVc%2FzgiVdM4ZOk%2F0W%2FzgFQGTRd7CWsWbeIQoo80P6z2xwpUA%3D%3D&response-content-disposition=attachment%3B+filename%3DWorldCupMatches.csv’
with requests.Session() as s:
download = s.get(CSV_URL)
decoded_content = download.content.decode(‘utf-8′)
cr = csv.reader(decoded_content.splitlines(), delimiter=’,’)
my_list = list(cr)
DF=pd.DataFrame(my_list)
DF.columns=DF.iloc[0]
FIFA_DF = DF.iloc[1:]
CleanDF=FIFA_DF.dropna(axis=0, how=’any’, subset=None, inplace=False)
print(CleanDF)


Summary:

The above mentioned code will generate a CSV file, and we can later on use that CSV data file in any BI tool like PowerBI for the analysis perspective.


Data Wrangling using Python

Introduction to Data Wrangling:

Primarily, data wrangling refers to the processing of data into various formats for the purpose of analysis like: grouping, concatenation and other requirements. In python, we have various built-in functions to perform required data wrangling process for better analytics. In the code, given below I have highlight some of the functions.

Pre Requisites:

Have Installed Python (I am using Jupyter Notebook)


Python Libraries:

Numpy

Pandas

Dataset(s) file (I am using CSV Data file, however we can perform using any other data frame and can also put data runtime as well. You can access the data using following link:

https://docs.google.com/spreadsheets/d/12HsYU0P6DmlsrmVTj0i-liSSGMxGZ1pXIfiglw7f1Qc/edit?usp=sharing


Data wrangling functions:

First of all lets import numpy and pandas libraries

import numpy as np

import pandas as pd

Read and Replace values:

#Read CSV File and Replace NULL Values with NAN

originaldata = pd.read_csv(‘./Group 1_CustomerData.csv’, encoding = ‘ISO-8859-1’, na_values = [‘NA’, ‘N/A’,’-‘])

print(originaldata)

Data Manipulation using Grouping and Filtering:

grouping = originaldata.groupby(‘city’)

print(grouping.get_group(‘Hong Kong’))

Data Manipulation using Sorting Data:

sorted_data = originaldata.sort_values(‘city’, # sort by City
ascending=False, # enable descending order
kind=’heapsort’, #sorting algorithm
na_position=’last’) # keep NaN value at last

print(sorted_data)

Dealing with Missing values:

#check weather there are missing values or not

sorted_data.isnull().values.any()

#lets calculate the no of missing values against each category

sorted_data.isnull().sum()

#####For missing values I am replacing with “Not Provided”

sorted_data[“middleName”].fillna(“Not Provided”, inplace = True)

###repeat this step for all categories/columns and verify the results

print(sorted_data)

Data Manipulation using Merge:

Data manipulation includes sorting, merging, grouping, and altering the data. Pandas offers multiple functions to manipulate data as: Sorting, Grouping and Merging.

we have already discuss the sorting and grouping. For merge we are using the same code and here is the working of merge:

In Python Pandas library has merge function which can be used to combine two dataframes, just like two SQL tables using joins as:

  • head and tail will get the three rows from the top and bottom as dataframes.
  • outer is required to combine two dissimilar (no common rows) dataframes (tables).
  • Enabling indicator will provide information about the dataframe source of each row (left or right).


mergedata = pd.merge(sorted_data.head(3),
sorted_data.tail(3),
how=’outer’,
indicator = True)


#lets see the difference

print(mergedata)


#Similarly for Concatenate:

top_df = sorted_data.head(3)
bottom_df = sorted_data.tail(3)
combined_originaldata = pd.concat( [top_df, bottom_df] )

print(combined_originaldata)


Reshaping and PIVOT data:

#PIVOT data

Pivotdata = combined_originaldata.pivot(index=’customerNo’,columns=’firstName’,values=’zipCode’)

print(Pivotdata)

#Stacked Data

Stacked_data = Pivotdata.stack()

print(Stacked_data)


#Now let’s check the duplicates:

Duplicates = sorted_data.duplicated(subset=None, keep=’first’)

print(Duplicates)

Aggregate functions:

total_customers = sorted_data[‘customerNo’].count()

print(total_customers)

#Insert count in to data file:

sorted_data.insert(2, “total_customers”, total_customers)

print(sorted_data)

Aggregated_data = sorted_data.pivot_table(index=’customerNo’,columns=’firstName’,values=’zipCode’, aggfunc=[‘count’])


print(Aggregated_data)


We can also rename the headers using following code:

sorted_data.rename(columns = {‘Unnamed: 102′:’Renamed Column 1’}, inplace = True)

print(sorted_data)


Write data into CSV file:

Write data into a CSV file and save it into directory

#Create CSV File and put wrangling data into file

sorted_data.to_csv(‘datawrangling.csv’,
index=False,
sep=’,’,
encoding=’utf-8′)


Summary:

In this post, I have discussed various data wrangling functions available built-in in Pandas library for Python. In coming posts, we will try to explore more features.


How to apply PGP Encryption on Datasets IN Python

Problem Statement:

We have a confidential datasets and we want to apply PGP encryption on datasets using python scripting. As, in PGP encryption we have Public as well as Private key. Public Key is used to encrypt the message and Private key is used to decrypt that data files in an actual form. In this code, we will be used several python libraries to achieve the solution.

Pre Requisites:

  • Python 3+
  • Jupyter Notebook (Preferably)
  • Data files (For this post, I am using the data file, which is available in following link):                                                                                                                https://docs.google.com/spreadsheets/d/12HsYU0P6DmlsrmVTj0i-liSSGMxGZ1pXIfiglw7f1Qc/edit?usp=sharing
  • Generate Public and Private Keys and save them in the directory (save the file to the same path in which python code file is being saved), to avoid configuration issues. And if you don’t know how to generate these keys, you may use one of the following link to generate:
  1. https://www.intel.com/content/www/us/en/security-center/pgp-public-key.html
  2. https://www.igolder.com/pgp/generate-key/


Python Libraries used in Code:

  1. PGPY
  2. Pandas
  3. Dill


Python Code:


pip install pgpy

import pgpy

pip install pandas

import pandas as pd

from io import StringIO

pip install dill

import dill

######This is the function#####3

def convertToDF(data):
if type(data) == str:
s = data
else:
try:
s = str(data,’utf-8′)
except:
s = str(data,’latin1′)

data = StringIO(s)
df = pd.read_csv(data)
return df

#####Accessing the Public Key File#####

pubKey, _ = pgpy.PGPKey.from_file(‘./publicKey.key’)

######Accessing Private Key File #####

priKey, _ = pgpy.PGPKey.from_file(‘./privateKey.key’)


###Accessing Data file####

fileName = “./Group 1_CustomerData.csv”
file_message = pgpy.PGPMessage.new(fileName, file=True)


####Review the message####

print(file_message)

print (type(file_message))

originalData = convertToDF(file_message.message)

print(originalData)


## Apply Encryption and review encrypted Data#####

encryptedData = pubKey.encrypt(file_message)

print(encryptedData)


####Saving Encrypted Data #####

saveFile = “EncryptedData”
with open(saveFile+’.pkl’, ‘wb’) as file:
dill.dump(encryptedData, file)

### Loading Encrypted Data #####

loadFile = “EncryptedData”
with open(loadFile+’.pkl’, ‘rb’) as file:
encLData = dill.load(file)


recoveredData = convertToDF(decryptedData.message)

print(decryptedData)

### Review the Recovered Data###

print(recoveredData)


Summary:

There may be many other solutions to achieve this problem, i found it most easy and simple one using the above mentioned libraries. In this scenario the choose of input data is the CSV file, but with minor changes we can also automate this process. I will upload that solution is my coming posts.


Tableau Refresh

https://ajax.googleapis.com/ajax/libs/jquery/2.2.4/jquery.min.js /* * Countdown 360 – v0.1.9 * https://github.com/johnschult/jquery.countdown360 * Original countdown plugin made by John Schult, under MIT License * * https://github.com/nledenyi/tableau-auto-refresh * Improvements and minor modifications to make the plugin work with Tableau made by Norbert Ledenyi, under MIT License */ ;(function ($, window, document, undefined) { var pluginName = “countdown360”, defaults = { radius: 30, // radius of arc strokeStyle: “#477050”, // the color of the stroke strokeWidth: undefined, // the stroke width, dynamically calulated if omitted in options fillStyle: “#8ac575”, // the fill color fontColor: “#ffffff”, // the font color fontFamily: “sans-serif”, // the font family fontSize: undefined, // the font size, dynamically calulated if omitted in options fontWeight: 700, // the font weight autostart: false, // start the countdown automatically seconds: 10, // the number of seconds to count down label: [“second”, “seconds”], // the label to use or false if none smooth: true, // should the timer be smooth or stepping direction: “cw”, // Clockwise (cw) or counter-clockwise (ccw) onComplete: function () {} }; function Plugin(element, options) { this.element = element; this.settings = $.extend({}, defaults, options); if (!this.settings.fontSize) { this.settings.fontSize = this.settings.radius/1.2; } if (!this.settings.strokeWidth) { this.settings.strokeWidth = this.settings.radius/4; } this._defaults = defaults; this._name = pluginName; this._init(); } Plugin.prototype = { getStatus: function() { return this.interval != undefined; }, start: function () { this.startedAt = new Date(); this._drawCountdownShape(Math.PI*3.5, true); this._drawCountdownLabel(0); var timerInterval = 1000; if (this.settings.smooth) { timerInterval = 16; } this.interval = clearInterval(this.interval); this.interval = setInterval(jQuery.proxy(this._draw, this), timerInterval); }, stop: function (cb) { this.interval = clearInterval(this.interval); if (cb) { cb(); } }, pause: function () { if (this.getStatus()) { this.msElasped = (new Date().getTime() – this.startedAt.getTime()); this.stop(); this._draw(); } }, cont: function () { if (!this.getStatus() && this.msElasped != undefined) { this.startedAt = new Date(new Date().getTime() – this.msElasped); var timerInterval = 1000; if (this.settings.smooth) { timerInterval = 16; } this.interval = clearInterval(this.interval); this.interval = setInterval(jQuery.proxy(this._draw, this), timerInterval); this.msElasped = undefined; } }, showControls: function (controlsFlag) { this.controls = controlsFlag; if (!this.getStatus() || !this.settings.smooth) { this._draw(); } }, _init: function () { this.settings.width = (this.settings.radius * 2) + (this.settings.strokeWidth * 2); this.settings.height = this.settings.width; this.settings.arcX = this.settings.radius + this.settings.strokeWidth; this.settings.arcY = this.settings.arcX; this._initPen(this._getCanvas()); if (this.settings.autostart) { this.start(); } }, _getCanvas: function () { var $canvas = $(“” + “” + “”); $(this.element).prepend($canvas[0]); return $canvas[0]; }, _initPen: function (canvas) { this.pen = canvas.getContext(“2d”); this.pen.lineWidth = this.settings.strokeWidth; this.pen.strokeStyle = this.settings.strokeStyle; this.pen.fillStyle = this.settings.fillStyle; this.pen.textAlign = “center”; this.pen.textBaseline = “middle”; this.ariaText = $(canvas).children(“#countdown-text”); this._clearRect(); }, _clearRect: function () { this.pen.clearRect(0, 0, this.settings.width, this.settings.height); }, _secondsLeft: function(secondsElapsed) { return this.settings.seconds – secondsElapsed; }, _drawCountdownLabel: function (secondsElapsed) { this.ariaText.text(secondsLeft); this.pen.font = this.settings.fontWeight + ” ” + this.settings.fontSize + “px ” + this.settings.fontFamily; var secondsLeft = this._secondsLeft(secondsElapsed), label = secondsLeft === 1 ? this.settings.label[0] : this.settings.label[1], drawLabel = this.settings.label && this.settings.label.length === 2 && !this.controls, x = this.settings.width/2; if (drawLabel) { y = this.settings.height/2 – (this.settings.fontSize/6.2); } else { y = this.settings.height/2; } if (this.controls) { this.pen.fillStyle = this.settings.fontColor; if (this.getStatus()) { this.pen.fillText(“❚❚”,x,y); // media control character for pause } else { this.pen.fillText(“▶”,x,y); // media control character for play } } else { this.pen.fillStyle = this.settings.fillStyle; this.pen.fillText(secondsLeft + 1, x, y); this.pen.fillStyle = this.settings.fontColor; this.pen.fillText(secondsLeft, x, y); } if (drawLabel) { this.pen.font = “normal small-caps ” + (this.settings.fontSize/3) + “px ” + this.settings.fontFamily; this.pen.fillText(label, this.settings.width/2, this.settings.height/2 + (this.settings.fontSize/2.2)); } }, _drawCountdownShape: function (endAngle, drawStroke) { this.pen.fillStyle = this.settings.fillStyle; this.pen.beginPath(); this.pen.arc(this.settings.arcX, this.settings.arcY, this.settings.radius, Math.PI*1.5, endAngle, false); this.pen.fill(); if (drawStroke) { this.pen.stroke(); } }, _draw: function () { var millisElapsed, secondsElapsed; millisElapsed = new Date().getTime() – this.startedAt.getTime(); if (!this.getStatus() && this.msElasped != undefined) { millisElapsed = this.msElasped; } secondsElapsed = Math.floor((millisElapsed)/1000); if (this.settings.smooth) { endAngle = (Math.PI*3.5) – (((Math.PI*2)/(this.settings.seconds * 1000)) * millisElapsed); } else { endAngle = (Math.PI*3.5) – (((Math.PI*2)/(this.settings.seconds)) * secondsElapsed); } if (this.settings.direction == “cw”) { endAngle = (Math.PI) – endAngle } this._clearRect(); this._drawCountdownShape(Math.PI*3.5, false); if (secondsElapsed < this.settings.seconds) { this._drawCountdownShape(endAngle, true); this._drawCountdownLabel(secondsElapsed); } else { if (this.settings.direction == "cw") { endAngle = Math.PI*3.5; // angle for a full circle } else { endAngle = Math.PI*1.5; // angle for no circle } this._drawCountdownShape(endAngle, true); this._drawCountdownLabel(this.settings.seconds); if (this.getStatus()) { this.stop(); this.settings.onComplete(); } } } }; $.fn[pluginName] = function (options) { var plugin; this.each(function() { plugin = $.data(this, "plugin_" + pluginName); if (!plugin) { plugin = new Plugin(this, options); $.data(this, "plugin_" + pluginName, plugin); } }); return plugin; }; })(jQuery, window, document); getTableau = function() { return parent.parent.tableau; }; getCurrentViz = function() { return getTableau().VizManager.getVizs()[0]; }; getCurrentWorkbook = function() { return getCurrentViz().getWorkbook(); }; onParamChange = function(parameterEvent) { return parameterEvent.getParameterAsync().then(getParameter); }; getParameter = function(parameter) { if (parameter.getName().lastIndexOf("autoRefresh_",0) === 0) { processParam(parameter.getName(),parameter.getCurrentValue().value); } }; getParameters = function(parameters) { for(i=0;i<parameters.length;i++){ if (parameters[i].getName().lastIndexOf("autoRefresh_",0) === 0) { processParam(parameters[i].getName(),parameters[i].getCurrentValue().value); } } countdown.start(); }; processParam = function(parameter, value) { console.log("AutoRefresh parameter received: " + parameter + " with the value of " + value + ", type: "+ typeof(value)) parameter = parameter.substr(12); // Trim 'autoRefresh_' from the beginning switch (parameter) { case "seconds" : countdown.settings.seconds = parseInt(value); break; case "fontWeight" : countdown.settings.fontWeight = parseInt(value); break; case "radius" : countdown.pause(); $("#countdown360_countdown").remove(); countdown.settings.radius = parseFloat(value); countdown._init(); countdown.cont(); break; case "strokeWidth" : countdown.pause(); $("#countdown360_countdown").remove(); countdown.settings.strokeWidth = parseFloat(value); countdown._init(); countdown.cont(); break; case "fontSize" : countdown.settings.fontSize = parseFloat(value); break; case "direction" : countdown.settings.direction = (String(value) == "cw" ? "cw" : "ccw"); break; case "strokeStyle" : countdown.pen.strokeStyle = String(value); break; case "fillStyle" : countdown.settings.fillStyle = String(value); break; case "fontColor" : countdown.settings.fontColor = String(value); break; case "fontFamily" : countdown.settings.fontFamily = String(value); break; case "label" : countdown.settings.label = String(value).split(","); break; case "smooth" : countdown.pause(); countdown.settings.smooth = (String(value).toLowerCase() == "true"); countdown.cont(); break; default: console.log("AutoRefersh parameter received but could not be processed (" + parameter + "). Check if the parameter name is among the accepted ones."); } return true; } initAutoRefresh = function() { console.log("AutoRefresh init"); countdown._drawCountdownShape(Math.PI*3.5, false); countdown._drawCountdownLabel(0); tableau = getTableau(); workbook = getCurrentWorkbook(); viz = getCurrentViz(); viz.addEventListener(tableau.TableauEventName.PARAMETER_VALUE_CHANGE, onParamChange); workbook.getParametersAsync().then(getParameters); }; this.appApi = { initAutoRefresh: initAutoRefresh }; var countdown = $("#countdown").countdown360({ onComplete : function () { getCurrentViz().refreshDataAsync(); var target = window.parent.document.getElementById("loadingSpinner"); var observer = new MutationObserver(function(mutations) { mutations.forEach(function(mutationRecord) { if (!$(target).is(':visible')) { observer.disconnect(); countdown.start(); } }); }); var observerConfig = { attributes: true, attributeFilter: ['style'], childList: false, subtree: false }; observer.observe(target, observerConfig); } }); $('#countdown').click(function(e){ countdown.getStatus() ? countdown.pause() : countdown.cont(); });

Mens Boys Ballet Tights Knit Soft Gymnastic Dance Pants

Hello Guys,
Today I am giving my review on one of the best Product for Men’s. If you are doing daily exercises, at home or in a gym, if you practice dance, gymnastic and you want to make yourself comfortable all the time, then this Pent is one of the best product for you.
I recommend these Pants, made by AceAcr  for all of you.
You can get more detail about the product on following link:
Product Image:
Capture
My overall Rating will be:
Quality: 5/5
Price: 5/5
Thanks for Your Visit…!
Asad Masood Qazi

Who really uses Business Intelligence

Business Intelligence can be used by anyone who has these two thing:

A Business

and an Intelligence

Business gives you the people, data, behavior, model, and so on. Whereas, Intelligence will give you to generate answers, resolve queries, taking actions and so on.

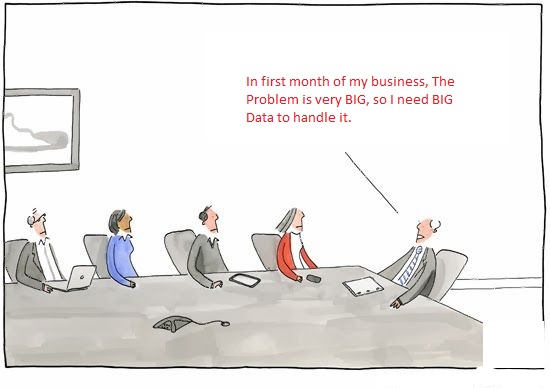
Intelligence doesn’t mean using the such high technology, which your business can not afford even. Intelligence tells the business what is right for it at this time. As an example you can refer to a below mentioned image.

So the209aa5cb94dd8b49745fc2c9c657ab9e

Micro Strategy 10 Downloading and Installation Step by Step Guide

Step 01: Download Micro Strategy

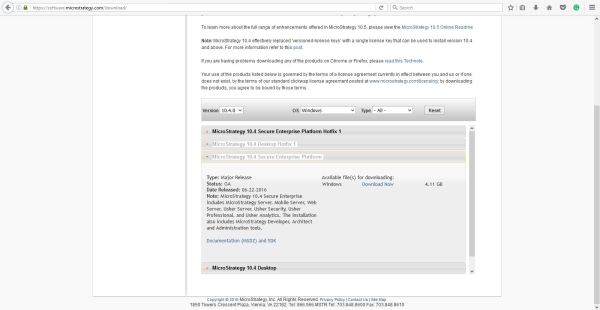
To download Micro Strategy products, visit following Address: http://software.microstrategy.com/download/. If you don’t have an access on downloading page, you may request access via email address, shown in this page.  After getting access, you may select a particular product that you required.

In this tutorial, I am using Micro Strategy 10.4.

download-01

Step 02: Open Setup File

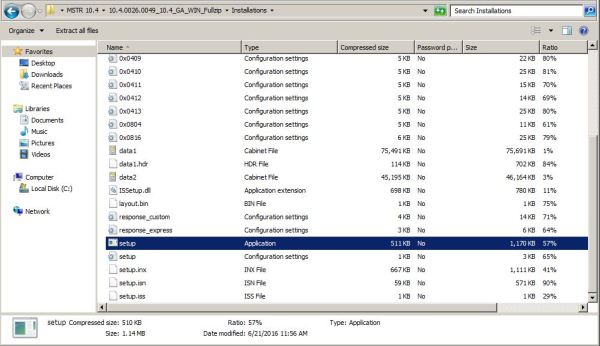
After downloading, you may extract the folder and Click on Setup  Executable file, which is located inside the Installation Folder, as shown below:

01

Step 03: Select Language Preference and Start the process

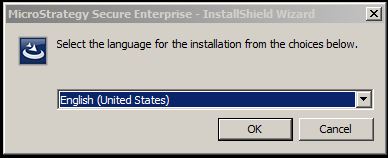
You may select any Language. But in this Tutorial, I am selecting the English Language. The process is shown below:

02

03

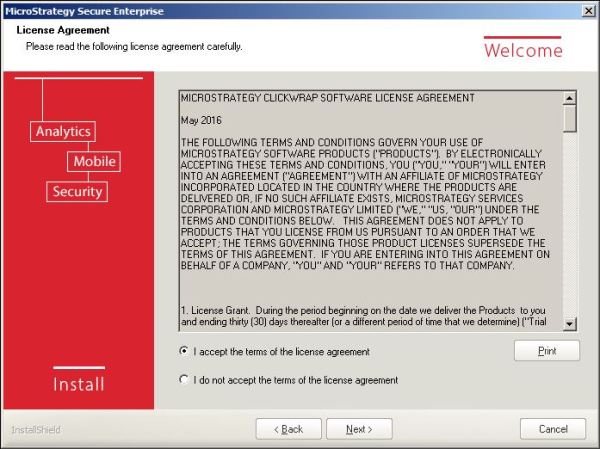
Step 04: License Agreement

By Clicking Next, you should Read and Accept the License agreement to proceed Next.The screen shots are presented below:

0405

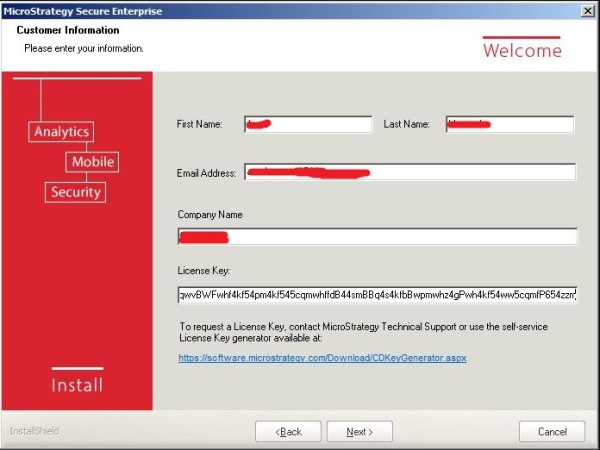
Step 05: Enter Personal Information

You are required to enter your some personal details and License Key (It is included in Download Package) as shown  below:

06-01

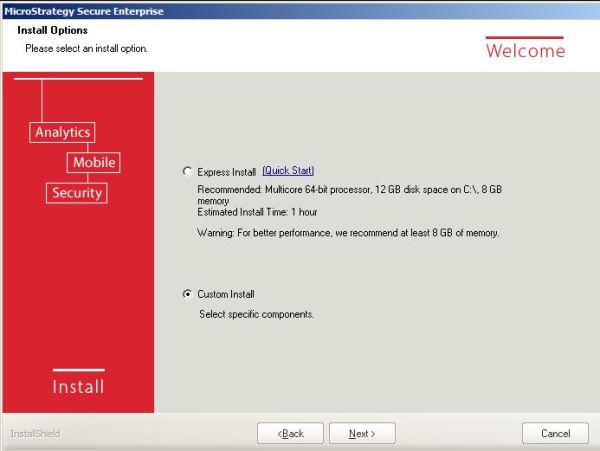
Step 06: Installation Procedure

In this step, you need to select the type of Installation Express or Custom. Express will install all the components whereas, in Custom menu, you may select required components of Micro Strategy. In this Tutorial, I am using Custom Type, as shown below:

07

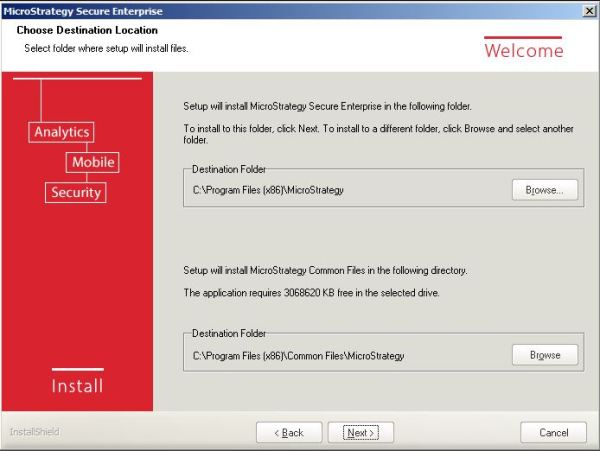
Now Select the Desired Destination Folder:08

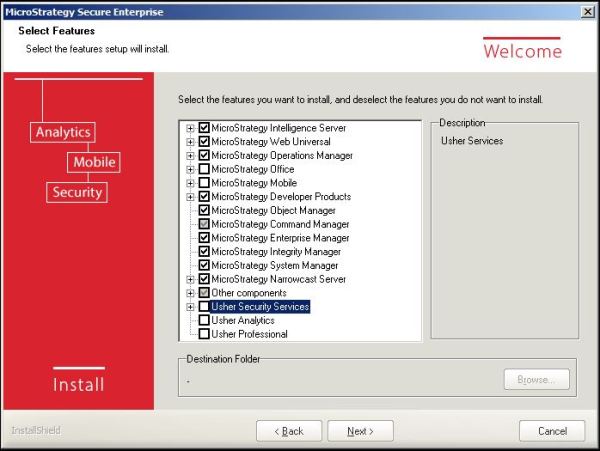
Select the Components and features you want to Install (This option will be shown if you select the Custom Installation Type):

09

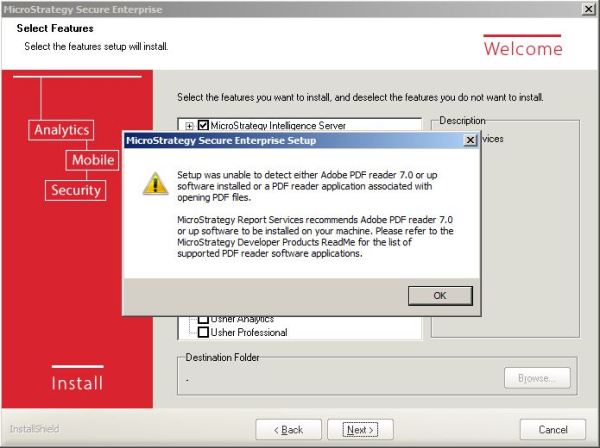
Press OK to Proceed:

10

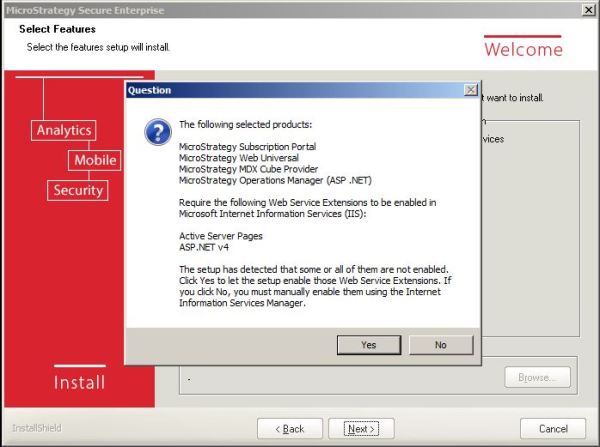
Allow the Installation to use following features:11

You may use Default as System Account for Health Center Setting:12

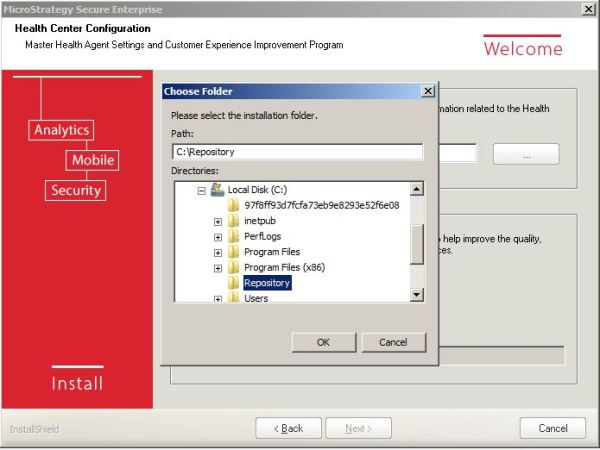
Select a Folder for Repository. You may select any New Empty folder. 13

Participate or Not Participate Program (It’s upto You)14

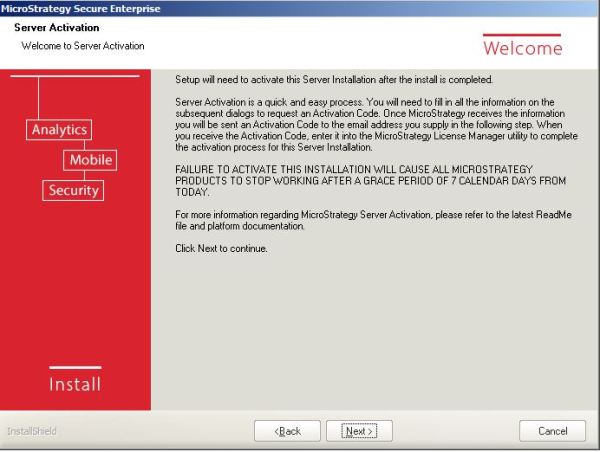
Press OK to Server Activation15

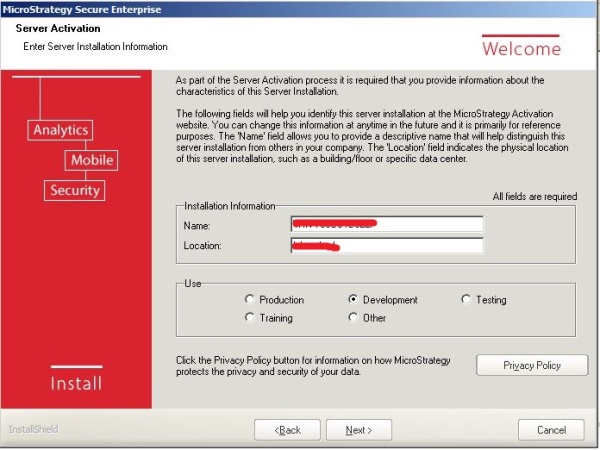
Enter Your Information, Purpose of Use 16-01

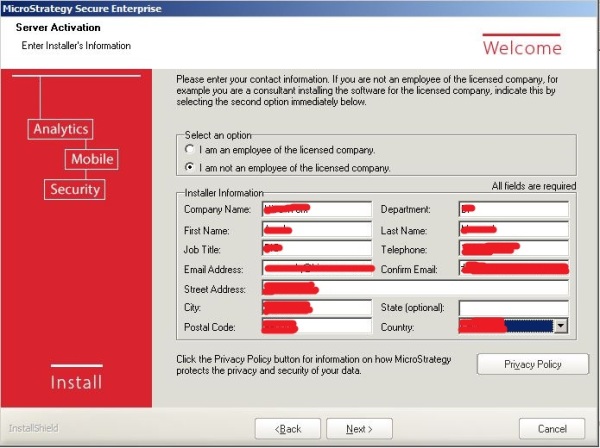
If Your Organization don’t have a License you may choose Second option17-01

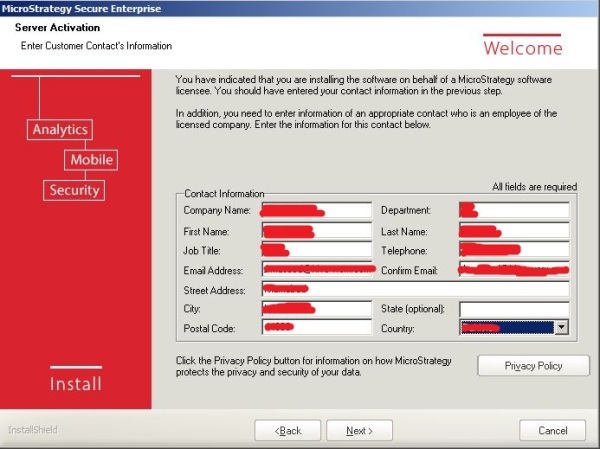
Again enter you personal Information:

18-01

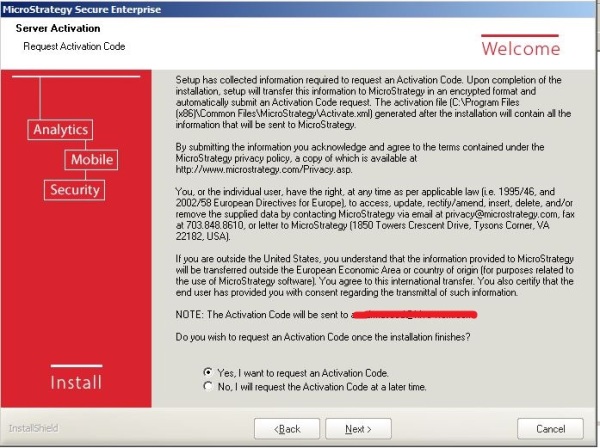
Check YES to receive the Activation Code:19-01

Review Installation Settings:20

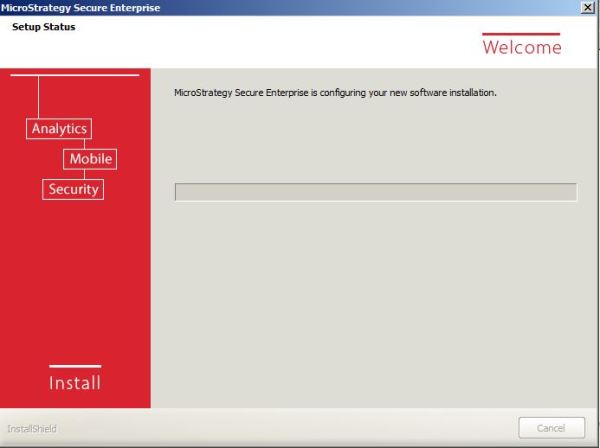
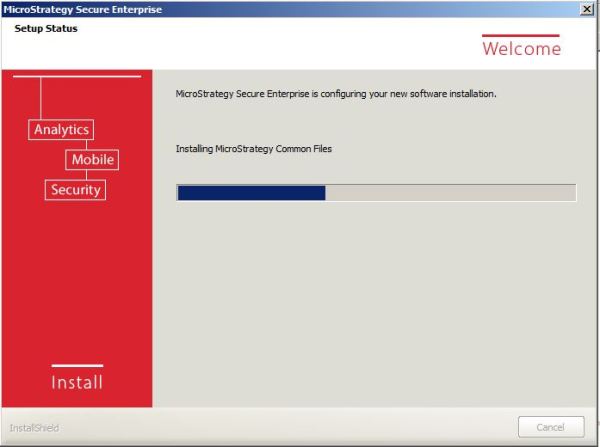
Setup Status Progress21

Setup continue…..2223

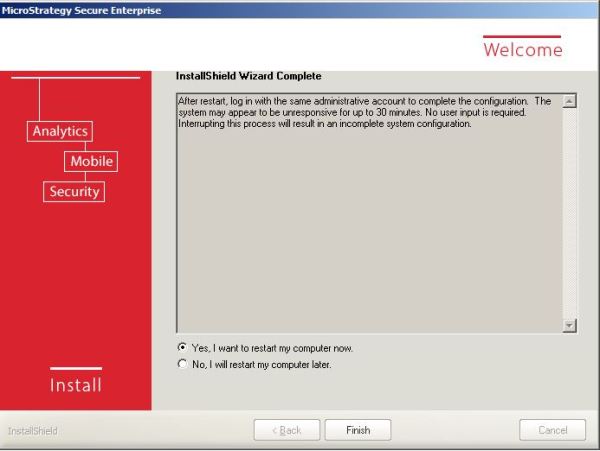
Restart Your Computer:

24

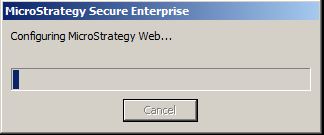
After Restart Microstrategy is being configured:

25

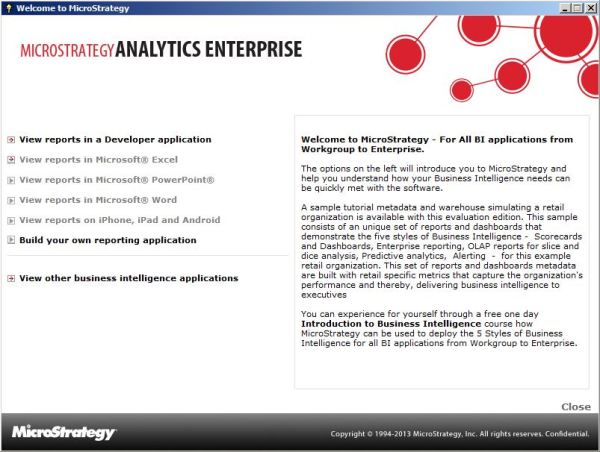
Welcome to Micro Strategy:26

Thank you so much for Visiting my Blog! Please don’t forget to give Feedback.